Docker Metrics
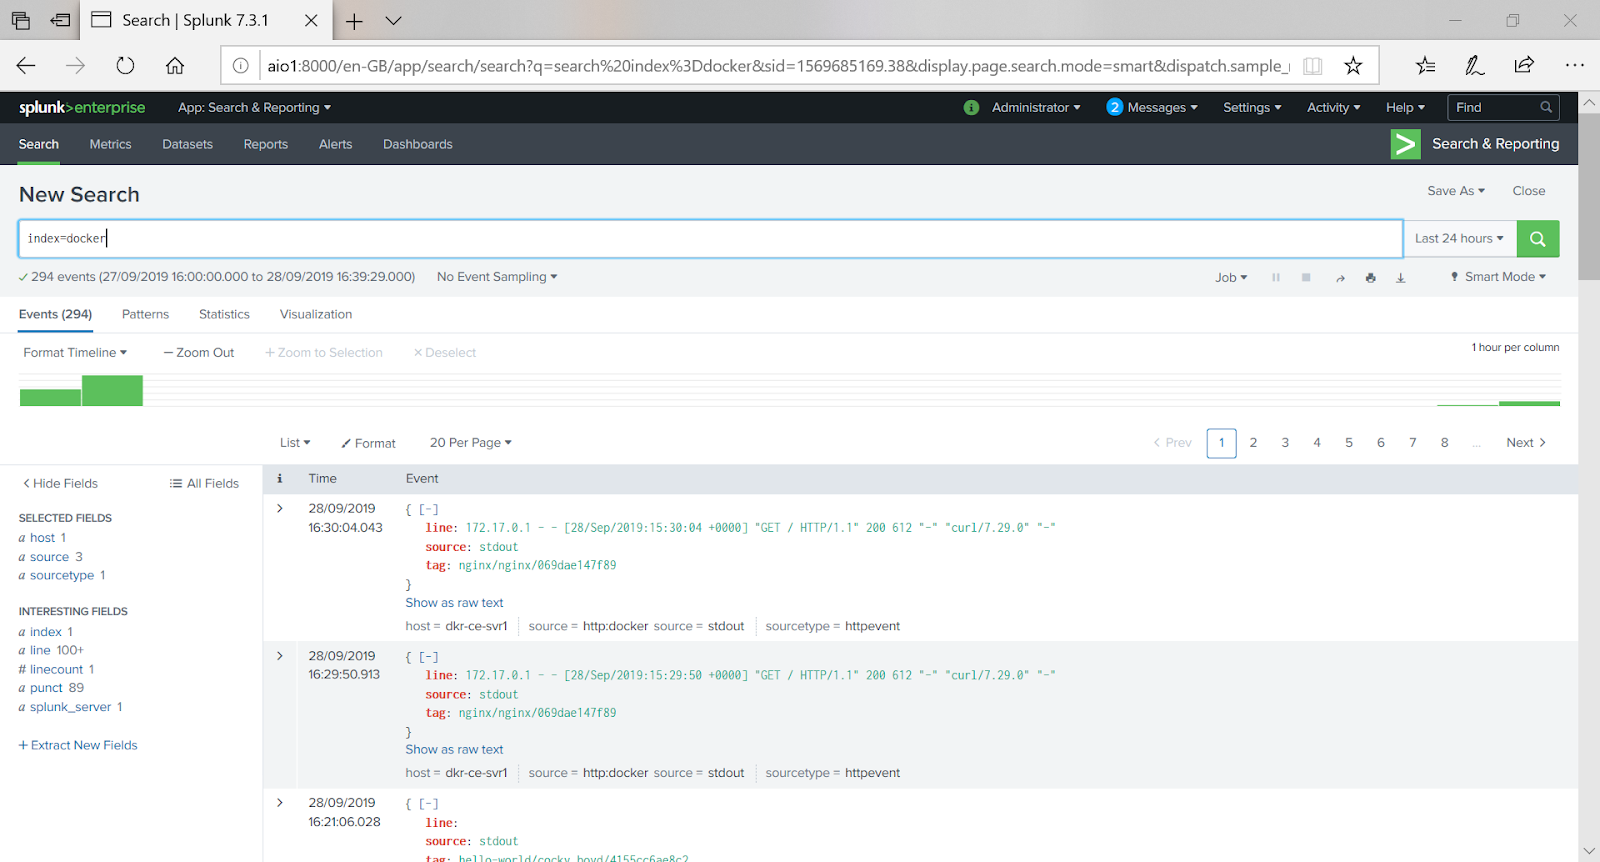
My last blog Monitoring Docker Container Logs covered collecting logs from the NGINX container running on our host. We'll now look at collecting host and container metrics.
Container metrics allow you to understand resource utilization and identify any potential resource constraints in your containerised infrastructure. By collecting these metrics we will be able to track Docker events and container status as well as CPU, memory, I/O, and network metrics.
To collect metrics from the host, we will be using collectd and for the containers the docker_collectd_plugin via lebauce(Sylvain Baubeau, GitHub), it's a Docker plugin for collectd using docker-py and collectd's Python plugin.
Install Collectd
1. Run the following to install collectd:
4. Start collectd

To collect metrics from the containers, you'll need to clone the docker-collectd-plugin to /usr/share/collectd/ using Git, to install:
5. Log back into Splunk
6. Navigate back to the Metrics Workspace and under the Metrics you should see Docker, expand to explore container metrics

Enjoy exploring the metrics and building insightful dashboards for your host and containers.
Container metrics allow you to understand resource utilization and identify any potential resource constraints in your containerised infrastructure. By collecting these metrics we will be able to track Docker events and container status as well as CPU, memory, I/O, and network metrics.
To collect metrics from the host, we will be using collectd and for the containers the docker_collectd_plugin via lebauce(Sylvain Baubeau, GitHub), it's a Docker plugin for collectd using docker-py and collectd's Python plugin.
Install Collectd
1. Run the following to install collectd:
sudo yum install epel-release2. Modify collectd.conf as per Splunk docs Enable and Configure Plugins to gather the basic OS level metrics, paying attention to the write_http plugin
sudo yum install collectd
LoadPlugin write_http3. In order for collectd to write to Splunk, we will need to configure a HEC Input that sends the data to a metrics index. Refer to Splunk docs Configure the HTTP Event Collector (HEC) data input
<Plugin write_http>
<Node "node1">
URL "http://<SERVER NAME>:8088/services/collector/raw"
Header "Authorization: Splunk <HEC TOKEN>"
Format "JSON"
VerifyPeer false
VerifyHost false
Metrics true
StoreRates true
</Node>
</Plugin>
4. Start collectd
systemctl start collectd.service5. Log onto Splunk and navigate to Apps>Search & Reporting>Metrics to the Metrics Workspace and on the left you'll see Metrics that you can explore from the host
To collect metrics from the containers, you'll need to clone the docker-collectd-plugin to /usr/share/collectd/ using Git, to install:
sudo yum install gitYou'll also need to install Pip
sudo yum update1. Git clone the docker-collectd-plugin
sudo yum -y install python-pip
cd /usr/share/collectd/ git clone https://github.com/lebauce/docker-collectd-plugin.git2. Install the Python requirements
pip install -r requirements.txt3. Modify collectd.conf to include the following:
TypesDB "/usr/share/collectd/docker-collectd-plugin/dockerplugin.db"
TypesDB "/usr/share/collectd/types.db"LoadPlugin python
<Plugin python>4. Restart collectd
ModulePath "/usr/share/collectd/docker-collectd-plugin"
Import "dockerplugin"
<Module dockerplugin>
BaseURL "unix://var/run/docker.sock"
Timeout 3
</Module>
</Plugin>
5. Log back into Splunk
6. Navigate back to the Metrics Workspace and under the Metrics you should see Docker, expand to explore container metrics
Enjoy exploring the metrics and building insightful dashboards for your host and containers.

Comments
Post a Comment